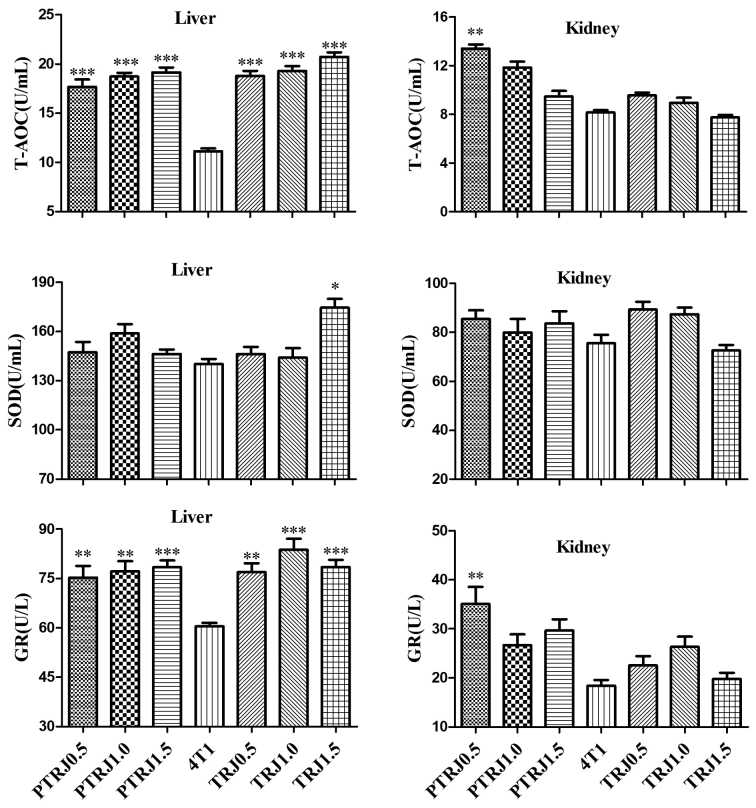
Figure 4.
Antioxidant levels in the liver and kidney tissue of the PTRJ, 4T1, and TRJ groups. Data are expressed as the mean ± standard error of the mean. *P<0.05, **P<0.01 and ***P<0.001 vs. 4T1-bearing mice. PTRJ, prophylactic-therapeutic royal jelly group; TRJ, therapeutic royal jelly group; SOD, superoxide dismutase; T-AOC, total antioxidant capacity; GR, glutathione reductase.

