
Fig. 3.
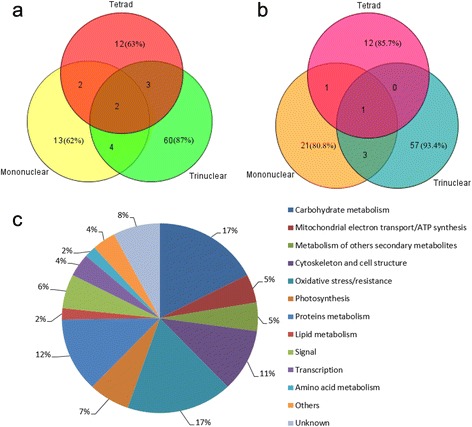
Stage-dependent distribution of DEPs and their classification into functional categories. a Venn diagram representing the number of proteins upregulated in PHYMS anthers (compared to MF-1376 anthers) at each of the three stages of development. b Venn diagram representing the number of proteins downregulated in PHYMS anthers (compared to MF-1376 anthers) at each of the three stages of development. c Functional classification and distribution of all 103 identified proteins based on sequence homology analysis as listed in Additional file 2: Table S1. Thirteen groups of protein species were categorized based on the putative functions of homologous proteins. The percentage of proteins in each group is indicated. Different colors represent different functional groups