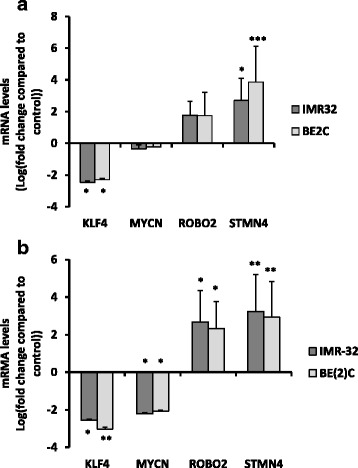
Fig. 2.

ATRA up-regulates differentiation markers ROBO2 and STMN4 and down-regulated the stem cell marker KLF4 in IMR-32 and BE(2)C cells. Relative mRNA levels for the target genes was determined by qPCR. a Graph displays the level of target gene expression in BE(2)C and IMR-32 cells after 3 days of ATRA (RA) treatment (10 μM) relative to DMSO treated cells, b shows the change in expression after 6 days of treatment with RA. Each bar in the graph represents the mean of technical replicates and three biological repeats. Error bars are SE (T-test). * p < 0.05, ** p < 0.01, *** p < 0.001
