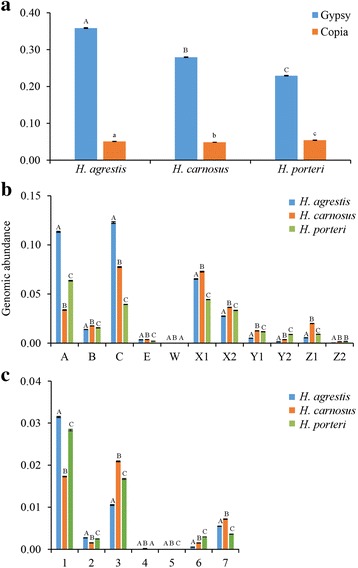
Fig. 1.

a Genomic abundance of gypsy and copia elements in three sunflower species based on similarity searches of graph-based clustering output to a reference panel of 52 full-length LTR retrotransposons. b and c Same information as in (a), but for different sublineages of gypsy (b) and copia (c). Error bars represent ±1 SE based on three biological replicates. Within a given element superfamily (panel a) or sublineage (panels b and c), histogram bars are labelled with different letter (A, B, C or a, b, c) when significant difference was determined (post-hoc Tukey test, P < 0.05)
