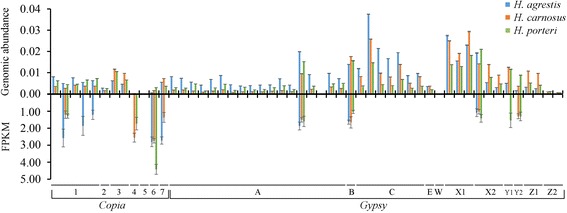
Fig. 2.

Genome abundance and expression level (FPKM) of 40 individual gypsy and 12 individual copia elements in three sunflower species. FPKM ≥1 was used as a cutoff for detectable expression. Error bars represent ±1 SE based on three biological replicates. Numerical and letter designations refer to different sublineages depicted in Additional file 1: Figure S2
