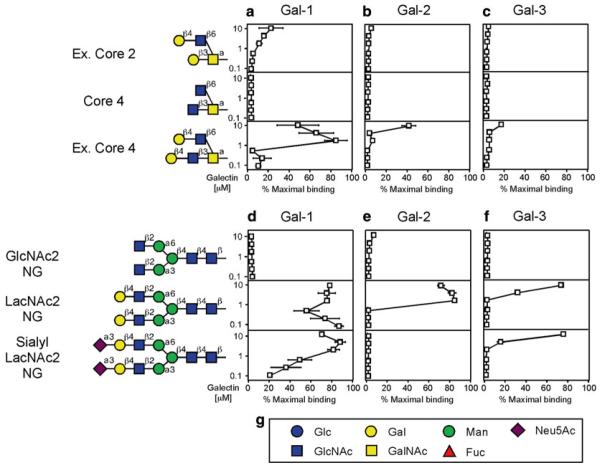
Fig. 3.
Examination of galectins over a range of concentrations can provide a relative affinity for individual ligands on the glycan microarray. Trivial names followed by the structures of each glycan tested are shown. Recognition of each representative glycan is displayed as the percent bound when compared with the highest bound ligand for each respective galectin tested in this study. Glycan recognition of O-glycans is shown for Gal-1 (a), Gal-2 (b), and Gal-3 (c). Glycan recognition of N-glycans is shown for Gal-1 (d), Gal-2 (e), and Gal-3 (f). (g) Legend of symbols for monosaccharides. This research was originally published in the Journal of Biological Chemistry [16] with permission from the American Society for Biochemistry and Molecular Biology

