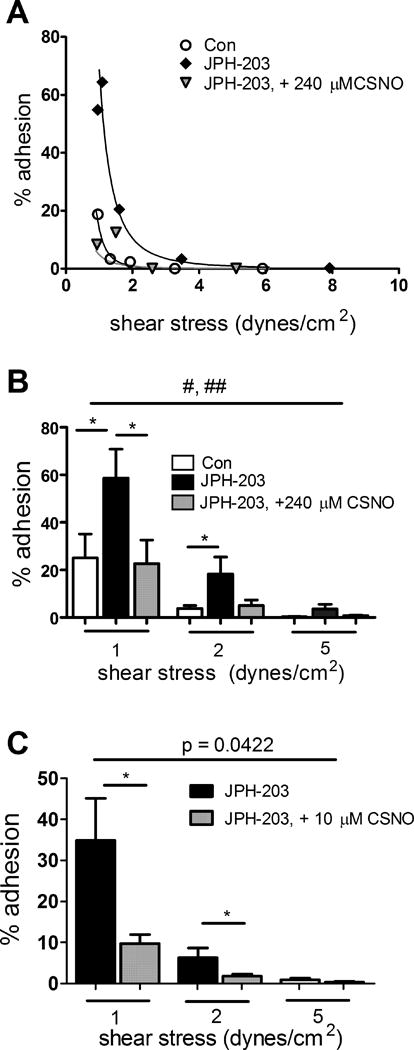
Figure 5. Influence on RBC-EC adhesion of treatment of RBCs alone with the LAT1-specific inhibitor JPH-203 (50 nM) with or without the addition of L-CSNO, D-CSNO, or L-Cys.

One set of individual adhesion curves is shown in (A) and the mean results from n=9 experiments using 240 µM L-CSNO at 1, 2, or 5 dynes/cm2 in (B). *, p<0.05 for the pair-wise comparison at the indicated shear stress (paired t-test). #, p=0.0004 for comparison of full Con vs. JPH curves (by two-way ANOVA); ##, p=0.0024 for JPH vs JPH + L-CSNO curves. (C-E), RBCs were treated with JPH-203, 50 nM, with or without the subsequent addition of (C), L-CSNO (n=6 pairs); (D), D-CSNO (n=6 pairs); or (E), L-Cys (n=6 pairs), 10 µM final in each case. With L-CSNO only, the differences at 1 and 2 dynes/cm2 were significant (*, p<0.05, paired t-test), and the curves differed significantly as indicated by two-way ANOVA.
