
Fig. 3.
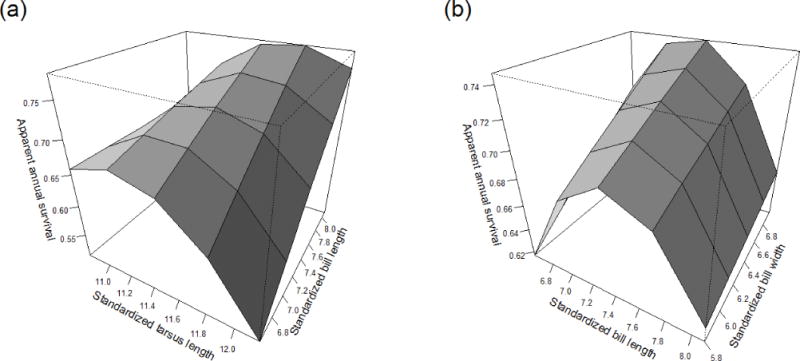
Correlational plot of annual apparent survival in relation to standardized measures of (a) tarsus length and bill length and (b) bill length and bill width for cliff swallows marked and recaptured in southwestern Nebraska, 1997–2010. Measurements were standardized by subtracting the mean from each and dividing by the standard deviation, with, for example, a standardized measure of −1 being an individual bird with a measurement one standard deviation below the mean. The actual trait values that correspond to standardized values of −2, −1, 0, 1, and 2 are depicted on the axes. When projecting annual survival estimates for a particular trait size, all other covariates were held at their mean value, and all survival estimates were generated from model 2 (Table 2).