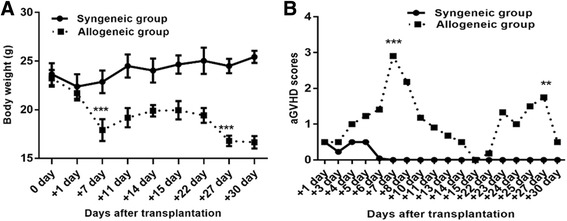
Fig. 1.

aGVHD was induced in recipient mouse with allogeneic HSCT compared with syngeneic HSCT. a Weight changes of recipient mice at different time-points. b GVHD scores evaluated in allogeneic and syngeneic groups at different time-points after transplant. **P < 0.05; ***P < 0.001. Bars and error bars represent the means and standard errors of the mean, respectively. n = 5 mice per time point per group
