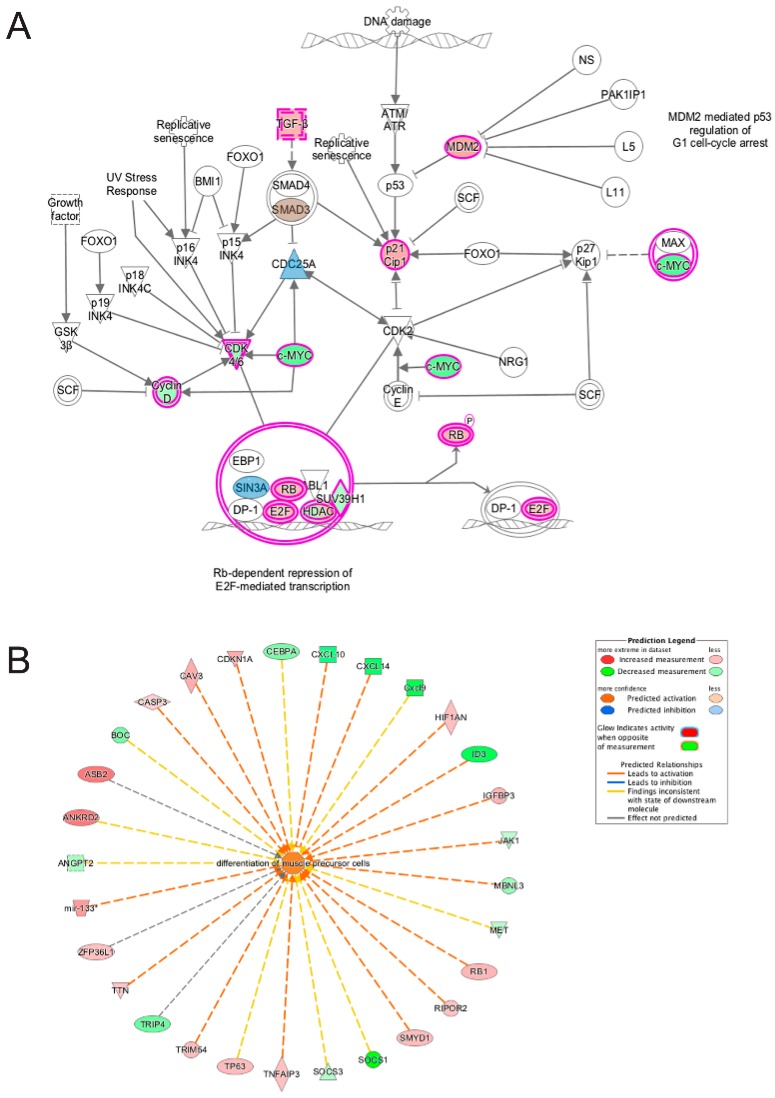
Figure 12.
Ingenuity pathway analysis of genes differentially expressed during the transition from differentiation day 0 to day 1 common to emerin-null cells and wildtype cells. (A) The Cell Cycle G1/S checkpoint regulation pathway is significantly enriched in both wildtype and emerin-null cell during transition from day 0 to day 1 of differentiation. The network was generated through the use of IPA (Ingenuity Systems, www.ingenuity.com) on normalized mRNA values. Nodes represent molecules in a pathway, while the biological relationship between nodes is represented by a line (edge). Edges are supported by at least one reference in the Ingenuity Knowledge Base. The intensity of color in a node indicates the degree of up- (red) or down- (green) regulation. Brown colored nodes (up-regulation) and blue colored nodes (down-regulation) indicate additional nodes in the pathway that are uniquely altered in emerin-null cells. Nodes are displayed using shapes that represent the functional class of a gene product (Circle = Other, Nested Circle = Group or Complex, Rhombus = Peptidase, Square = Cytokine, Triangle = Kinase, Vertical ellipse = Transmembrane receptor). Edges are marked with symbols to represent the relationship between nodes (Line only = Binding only, Flat line = inhibits, Solid arrow = Acts on, Solid arrow with flat line = inhibits and acts on, Open circle = leads to, Open arrow = translocates to). (B) Biological Function Analysis predicts activation of differentiation of muscle precursor cells in both wildtype cells and emerin-null cells during transition from day 0 to day 1 of differentiation (p-value: <0.001; Z-score: 1.350). The figure represents genes that are associated with a particular biological function that are altered in the uploaded dataset. Genes that are up-regulated are displayed within red nodes and those down-regulated are displayed within green nodes. The intensity of the color in a node indicates the degree of up-(red) or down-(green) regulation. The shapes of the nodes reflect the functional class of each gene product: transcriptional regulator (horizontal ellipse), transmembrane receptor (vertical ellipse), enzyme (vertical rhombus), cytokine/growth factor (square), kinase (inverted triangle) and complex/group/other (circle). An orange line indicates predicted upregulation, whereas a blue line indicates predicted downregulation. A yellow line indicates expression being contradictory to the prediction. Gray line indicates that direction of change is not predicted. Solid or broken edges indicate direct or indirect relationship, respectively.

