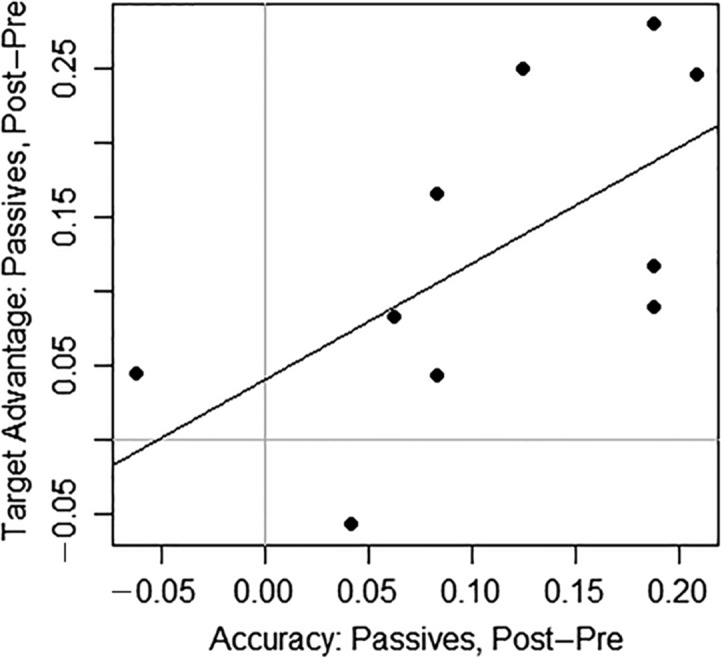
Figure 6.

Individual treatment results: Accuracy and eye movements. The x-axis indicates the change in the proportion of correct passive sentences in the eye-tracking task from pre- to posttreatment; the y-axis indicates the change in target advantage for passive sentences in S End from pre- to posttreatment. The gray vertical and horizontal lines indicate cutoffs for improvement in accuracy (to the right of the line) and target advantage (above the line), respectively; the regression line appears in black.
