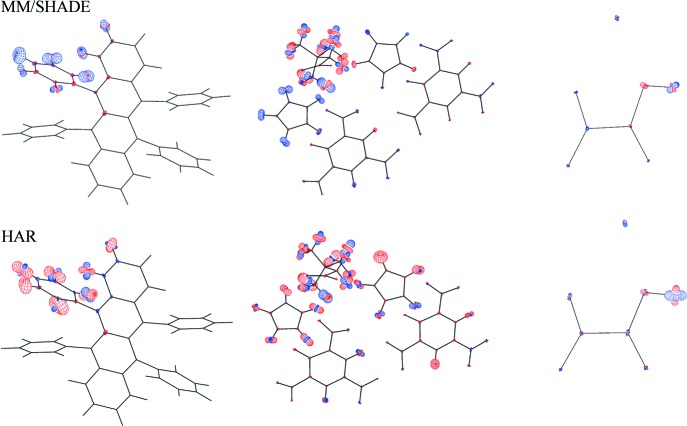
Figure 6.
Difference between neutron ADPs and those from MM/SHADE (top) or HAR refinements (bottom) for rubrene (left), BIPa (middle) and KHOx (right). The basis set was rhf/def2-TZVP, with charges or with a cluster, and the plots were drawn using the PEANUT software (Hummel et al., 1990 ▸). The plots refer to a 50% probability level of the ADP RMSDs, scaled by a factor of 2. Blue denotes positive and red negative.

