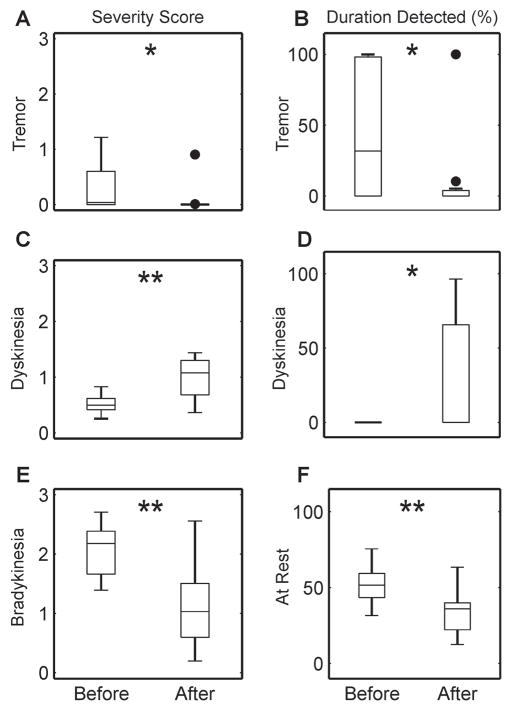
Fig. 3.
Boxplots of the objective metrics generated by the symptom quantification algorithms for periods before and after taking medication are shown in each panel. Average severity scores for tremor, dyskinesia, and bradykinesia are shown in Panels A, C, and E, while duration detected of tremor, dyskinesia, and time at rest are shown in Panels B, D, and F. Filled circles indicate outliers. Asterisks indicate statistically significant differences using a one-sided Wilcoxon signed rank test (*p < 0.01, **p < 0.001).

