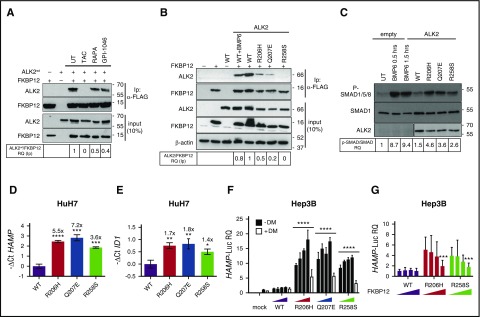
Figure 3.
Displacement of FKBP12 from ALK2 increases hepcidin through BMP-SMAD pathway activation. (A) HuH7 cells were transiently transfected with FKBP12MYC-FLAG and ALK2wt-MYC and treated with TAC (1 μg/mL), rapamycin (RAPA, 100 nM), GPI-1046 (100 μg/mL), or vehicle for 15 hours. Protein extracts were immunoprecipitated with an anti-FLAG M2 affinity gel (Sigma-Aldrich). Total extract and immunoprecipitated proteins were loaded onto a 12% SDS-PAGE and analyzed by western blot. ALK2 and FKBP12 were detected by using anti-MYC and anti-FKBP12 antibodies, respectively. Molecular weight markers are indicated on the right. (B) HuH7 cells were transfected with FKBP12MYC-FLAG in the presence of ALK2wt-MYC, ALK2R206H-MYC or ALK2Q207E-MYC, ALK2R258S-MYC, or empty vector. When indicated, cells were treated for 15 hours with BMP6 (100 ng/mL). Whole-cell extract was immunoprecipitated and analyzed as described in panel A. Molecular weight markers are indicated on the right. (C) HuH7 cells were transfected with the Smad1FLAG expressing vector in the presence of ALK2wt-MYC, ALK2R206H-MYC, ALK2Q207E-MYC, ALK2R258S-MYC, or empty vector (mock). When indicated, transfected cells were treated with BMP6 (50 ng/mL) for 30 minutes or 1.5 hours. Cells were lysed, loaded onto 10% SDS-PAGE, and analyzed by western blot. Activation of the BMP-SMAD pathway was detected by using an antibody recognizing phospho-SMAD1/5/8 and total SMAD1. ALK2 was detected by using anti-MYC antibody. Molecular weight markers are indicated on the right. (D,E) RNA was isolated from HuH7 cells transfected with ALK2wt-MYC-, ALK2R206H-MYC-, ALK2Q207E-MYC-, or ALK2R258S-MYC-expressing vector. Hepcidin (HAMP) (D) and ID1 (E) expression levels were quantified by qRT-PCR and normalized to the housekeeping gene GAPDH. Mean ΔCt values in each group were subjected to a change of origin by subtracting the mean ΔCt of ALK2wt-transfected cells (D: −1.2; E: −3.9). Estimates of the fold changes in gene expression (2−ΔΔCt) are shown on the graphs. (F) Hep3B cells were transfected with hepcidin promoter firefly luciferase reporter (HAMP-Luc) and increasing concentration of ALK2wt-MYC-FLAG-, ALK2R206H-MYC-FLAG-, ALK2Q207E-MYC-FLAG-, or ALK2R258S-MYC-FLAG-expressing vector. Cells transfected with the highest concentration of ALK2 cDNA were treated with dorsomorphin (DM, 10 μM). Cells were lysed and analyzed for the luciferase activity that was normalized to an untreated mean value of 1. (G) Hep3B cells were transfected with hepcidin promoter firefly luciferase reporter (HAMP-Luc), ALK2wt-MYC, ALK2R206H-MYC, ALK2R258S-MYC, or empty vector (mock) and increasing concentration of FKBP12. Luciferase activity was normalized to an untreated mean value of 1. (A-F) Representative results of experiments performed in triplicate. Error bars indicate SD. The 2-way ANOVA was used in panel F (ALK2 wt vs ALK2 mutants). *P < .05; **P < .01; ***P < .001; ****P < .0001. Western blot results are representative of 3 independent experiments.

