Figure 7.
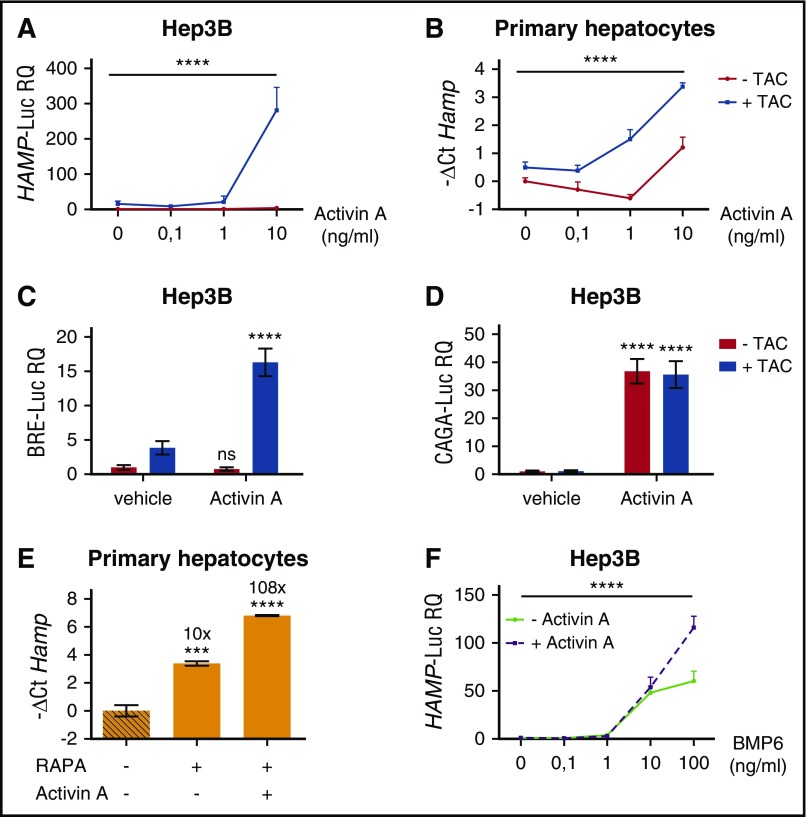
Pharmacologic displacement of FKBP12 from ALK2 leads to Activin A–dependent SMAD1/5/8 activation and hepcidin upregulation. (A) Hep3B cells, transfected with the hepcidin promoter luciferase reporter vector (HAMP-Luc) and ALK2wt-MYC-expressing vector, were pretreated with 1 μg/mL TAC or vehicle for 3 hours and then treated with increasing concentrations of Activin A, in the presence or absence of TAC, for 15 hours. Cells were lysed and analyzed for the luciferase activity that was normalized to an untreated mean value of 1. (B) Primary murine hepatocytes from WT mice were pretreated for 3 hours with 1 μg/mL TAC and incubated for 5 hours with Activin A (10 ng/mL) in the presence or absence of TAC. Hepcidin (Hamp) mRNA expression was quantified by qRT-PCR and normalized to the housekeeping gene Hprt1. Mean ΔCt values in each group were subjected to a change of origin by subtracting the mean ΔCt (−1.2) of untreated cells. A representative experiment, made in triplicate, is shown. SMAD1/5/8 and SMAD2/3 signaling pathways were analyses in Hep3B cells transfected with the BRE-Luc (C) and the CAGA-Luc (D) reporter vectors. Transfected cells were incubated with TAC (1 μg/mL) ± Activin A (10 ng/mL) and then lysed for analysis of the luciferase activity that was normalized to an untreated mean value of 1. A representative experiment, made in triplicate, is shown. (E) Murine primary hepatocytes were pretreated with 100 nM rapamycin (RAPA) for 3 hours and treated with Activin A (10 ng/mL) for 5 hours, in the presence or absence of RAPA. As control, cells were treated with Torin1 (T1, 100 nM). Cells were processed and analyzed as described in panel B. Mean ΔCt values in each group were subjected to a change of origin by subtracting the mean ΔCt (7.1) of untreated cells. (F) Hep3B cells, transfected with the hepcidin promoter luciferase reporter vector (HAMP-Luc), were treated for 15 hours with increasing concentration of BMP6 in presence or absence of 10 ng/mL of Activin A. Luciferase activity was analyzed and normalized to an untreated mean value of 1. A representative experiment, made in triplicate, is shown. Two-way ANOVA was used in panels A,B,F (ALK2 wt vs ALK2 mutants). **P < .01; ***P < .001; ****P < .0001. Estimates of the fold changes in gene expression (2−ΔΔCt) are shown in the graphs.

