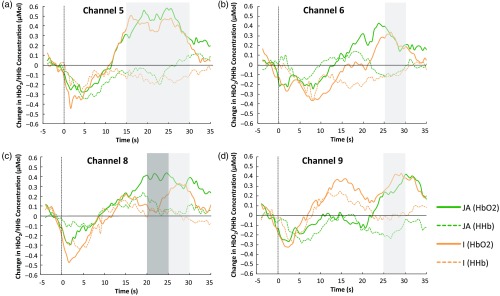
Fig. 6.
The grand averaged group time courses of the hemodynamic responses in and HHb to the JA and I conditions. Light grayed area indicates the time window, where we found a significant increase of compared to baseline for both the JA and I conditions. The dark grayed area indicates the time window, where the difference in change was significant between the JA and I conditions. (a) Channel 5, (b) channel 6, (c) channel 8, and (d) channel 9.

