
Figure 3.
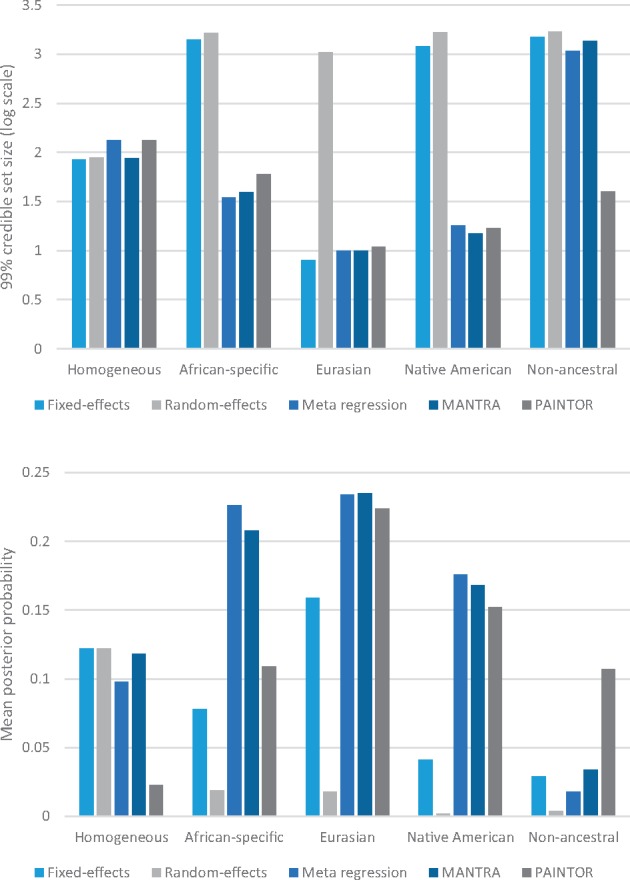
Metrics of fine-mapping resolution, with imputed data, across alternative approaches to aggregate GWAS across diverse populations: fixed-effects meta-analysis; random-effects meta-analysis; meta-regression including axes of genetic variation as covariates as implemented in MR-MEGA; MANTRA; and PAINTOR. Two metrics are presented: (i) the median number of SNPs in the 99% credible set on a log10-scale; and (ii) the mean posterior probability ascribed to the causal variant. Metrics are presented for each of five scenarios for heterogeneity in effects between populations, described in Supplementary Material, Table S1. In each scenario, the odds ratio has been fixed to obtain approximately 80% power to detect association at genome-wide significance (P < 5 × 10⁻⁸) in the meta-regression analysis.