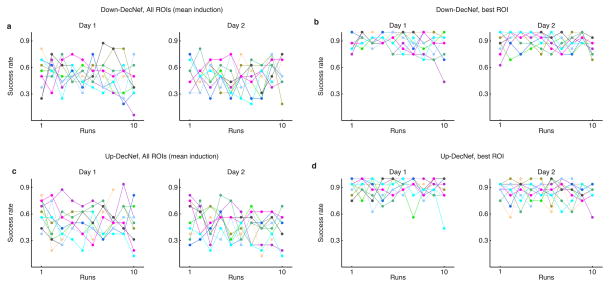
Fig. 2.
Individual participant’s success rates for each DecNef session (total, 4). (a–b) Success rate for Down-DecNef, with (a) representing the overall induction performance (all 4 ROIs averaged), as in the experimental session, while (b) is selective for the best ROI (single ROI with highest induction likelihood on a given trial). (c–d) Success rate for Up-DecNef, description same as above for Down-DecNef. Individual colors represent single participants. Dots represent the ratio of successful trials/total trials in each run.

