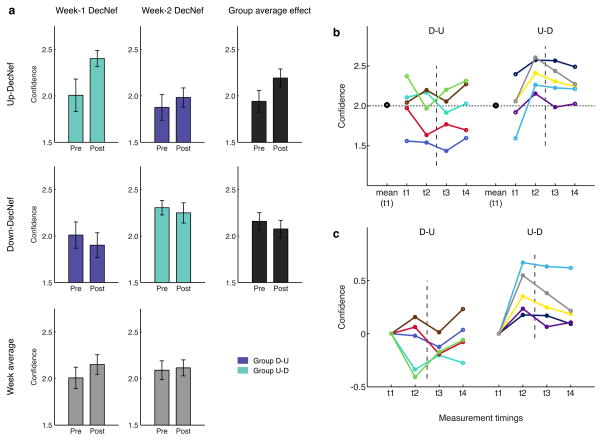
Fig. 3.
Confidence ratings in psychophysical Pre- and Post-Tests. (a) Each group induced both High and Low Confidence, in two separate sessions: group D-U with the order Low- then High-Confidence (Down then Up), and group U-D High- then Low Confidence. Results are color-coded: purple for single group results of group D-U and green for group U-D. Average across groups, representing mere order effect, is depicted in gray, at the bottom, while the grand average per condition (High and Low Confidence), is in black, on the right side. It is apparent that the confidence changes in the first week strongly influence the confidence level in the second week. The Pre- level in the second week remains indeed very close to the previous Post- level attained in the first week. Furthermore, neurofeedback in the first week seems to have a stronger impact than in the second week, and this holds when comparing both High with Low Confidence DecNef. For each bar, n = 5. Error bars represent s.e.m. (b–c) participants’ individual confidence data with the four measurement timings, organized in groups (D-U and U-D), both raw (b) and 0-aligned (c) confidence. In (b) the large black dots represent the group mean confidence level at t1. The horizontal dotted line the confidence level of 2.0. It is apparent that the two independent groups have almost equal starting points. Timings 1 and 2 correspond to Pre- and Post-Test in the first week, respectively; while timings 3 and 4 to Pre- and Post-Test in the second week DecNef. The dotted line represents the week-long interval between the two sessions (DecNef in week 1 and DecNef in week 2). Each colored line represents day-averaged data from one participant (total, n = 10).

