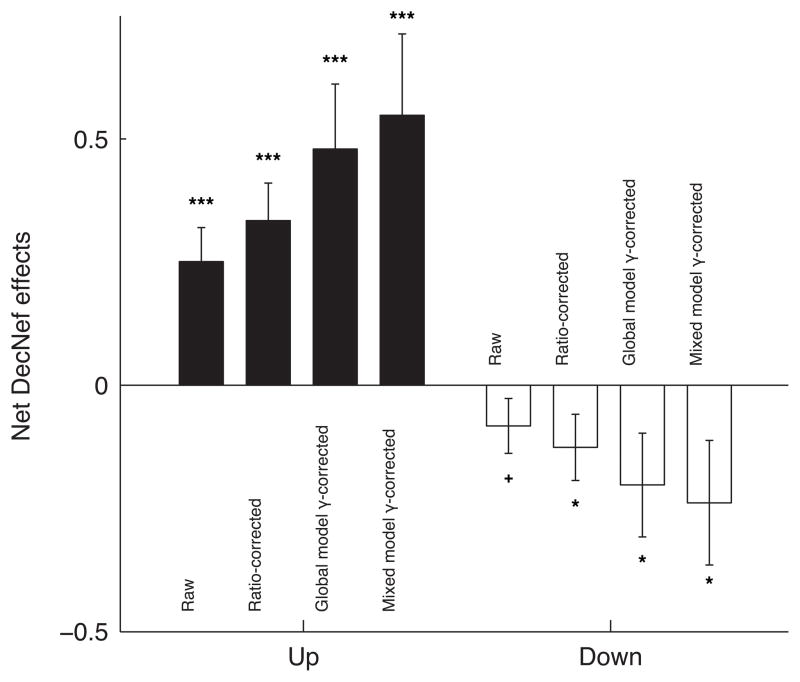
Fig. 7.
Net effects of Up- and Down-DecNef trainings. The first bar, labeled “raw”, represents the net change in confidence without any correction being applied. The following bars show the net change in confidence, with the second week difference between Pre- and Post-tests individually corrected by multiplying the difference by 1/γ, the parameter computed in the various modeling approaches described in the main text. One-tailed t-test results: + P = 0.087, * P < 0.05, *** P < 0.005.

