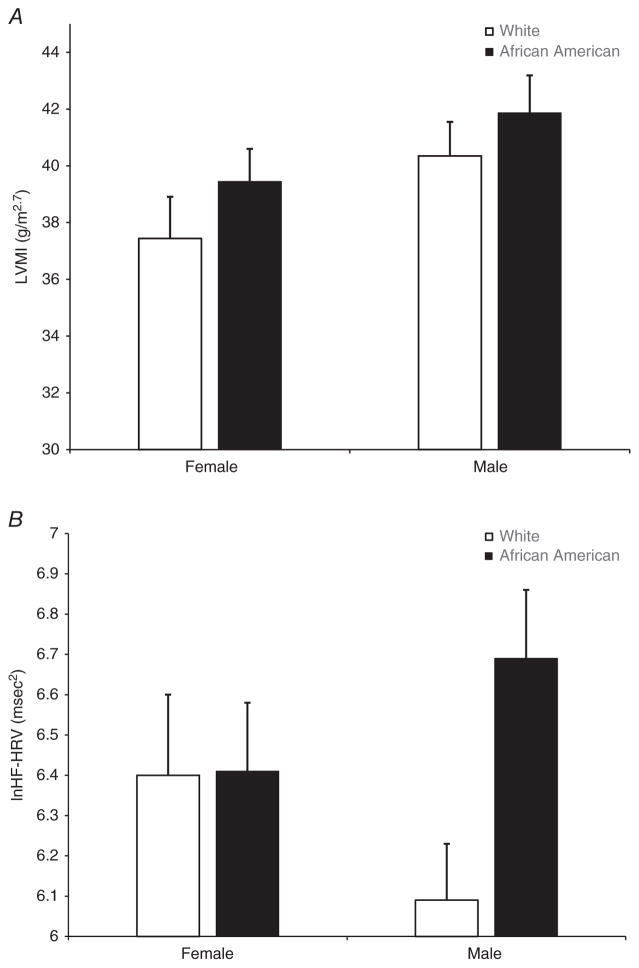
Figure 1. Bar graphs of mean left ventricular mass index (LVMI) and mean resting high-frequency heart rate variability (HF-HRV) by race and sex.
A, there was a significant main effect for sex, with men exhibiting greater LVMI compared with women (P = 0.041). B, there were no sex differences in HF-HRV. There was a non-significant trend for the race × sex interaction (P = 0.109), suggesting that African American men exhibited higher HF-HRV compared with White men. Error bars reflect SEM.

