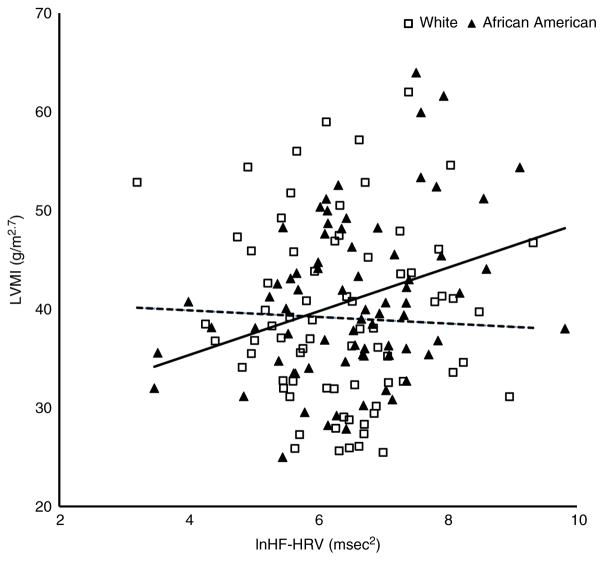
Figure 2. Scatterplot of left ventricular mass index (LVMI) and resting high-frequency heart rate variability (HF-HRV) in African Americans (filled triangles, continous line) compared with Whites (open squares, dashed line).
The simple slope for HF-HRV predicting LVMI was significant for African Americans (P = 0.002) but not for Whites (P = 0.919).

