


Figure 3.
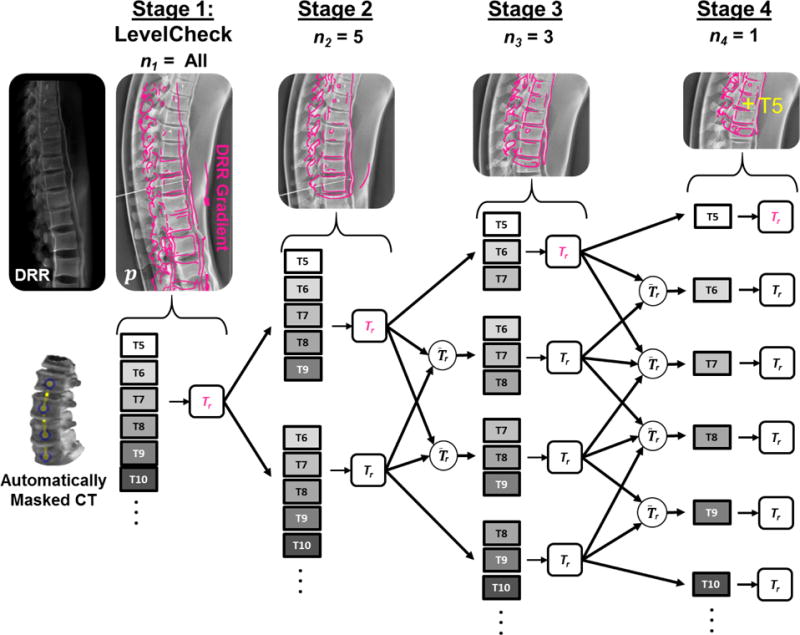
Illustration of msLevelCheck using 4 stages with the sub-image size, nk, for the stages set to {All, 5, 3, 1}. Images along the top show the projection image p with a DRR gradient overlay in magenta, depicting the progression of msLevelCheck along the upper arm of the registration framework for each stage in the multi-stage method.