


Figure 9.
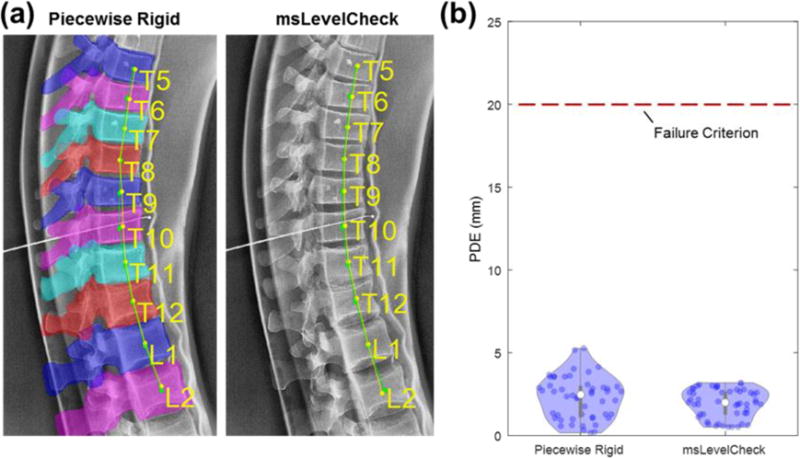
Comparison of performance for piecewise rigid and msLevelCheck. Results are shown for the case of maximum deformation in the spine phantom. (a) Illustration of registration for the piecewise rigid (overlaid with the projections of the requisite vertebrae segmentations) and msLevelCheck methods. (b) Violin plots show the distribution of PDE for the registered labels in each method, with median PDE shown as a solid white circle, upper and lower bounds given by the max and min PDE, and 50 individual sample points shown therein.