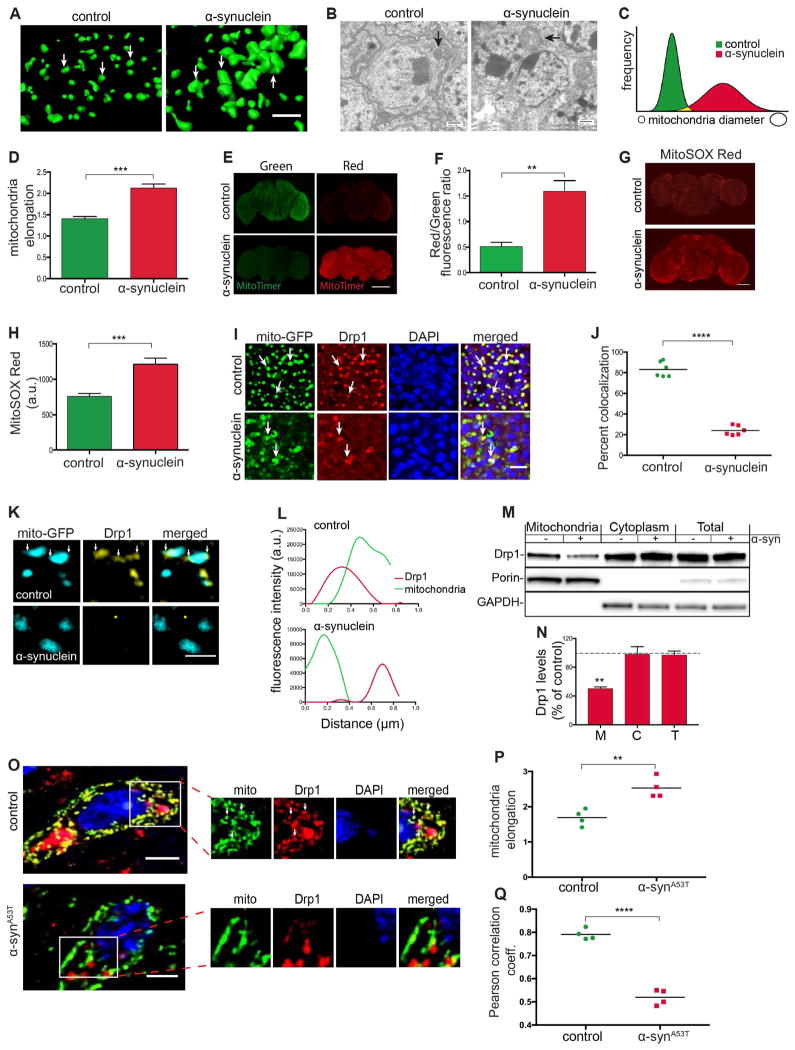
Figure 4. α-synuclein expression induces mitochondrial abnormalities.
(A) 3D reconstruction of immunofluorescence-stained mitochondria showing mitochondrial enlargement in central brain neurons of α-synuclein transgenic flies compared to control flies. Scale bar, 5 μm.
(B) Electron microscopic images of the fly brain cortex showing mitochondrial enlargement in neurons of α-synuclein transgenic flies compared to control flies (arrows). Scale bar, 500 nm.
(C and D) Measurements of mitochondrial diameter and elongation show changes in mitochondrial morphology in α-synuclein transgenic flies. n=6 per genotype.
(E and F) Oxidation of mitochondrial protein is elevated in whole mount brain preparations of α-synuclein transgenic flies compared with controls as monitored by the transition from green to red fluorescence in transgenic MitoTimer protein. Scale bar, 100 μm. n=6 per genotype. Control is elav-GAL4/+; UAS-MitoTimer/Syb-QF2.
(G and H) MitoSOX Red fluorescence (G) and quantification (H) in whole mount brain preparations from α-synuclein transgenic and control flies. Scale bar, 50 μm. n=6 per genotype.
(I and J) Mitochondrial (mito-GFP, green) colocalization with Drp1 (red) is reduced in neurons from α-synuclein transgenic fly brains. Scale bar, 5 μm. n=6 per genotype.
(K and L) Loss of mitochondrial localization of Drp1 as revealed by structured illumination microscopy. Scale bar, 1 μm.
(M and N) Western blot of mitochondria subcellular fractionation probed for Drp1 (M) and quantification (N) showing reduction in Drp1 levels in the mitochondria fraction of α-synuclein flies compared to control. Control is elav-GAL4/+; HA-Drp1/Syb-QF2.
(O – Q) Immunofluorescent staining for mitochondria (ATPVα) and Drp1 (O) shows mitochondrial enlargement (P) and reduced Drp1 colocalization (Q) in ~11-14-month-old A53T human α-synuclein transgenic mice compared to non-transgenic littermates. Scale bar, 5 μm. n=4 per genotype.
Asterisks indicate **p<0.001, ***p<0.0002 and ****p<0.0001. Unpaired t-test. Data is represented as mean ± SEM. Flies are 10 days old in (A)–(L) and 1 day old in (M) and (N). Control in (A)–(D), (G) and (H) is elav-GAL4/+; Syb-QF2. Control in (I)–(L) is elav-GAL4/+; UAS-mito-GFP/+; HA-Drp1/Syb-QF2.
See also Figure S4.

