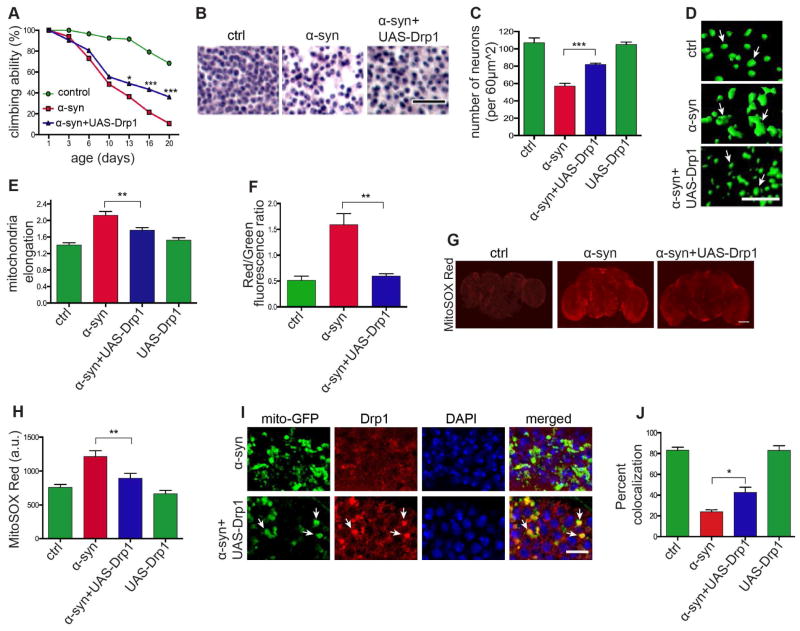
Figure 5. Overexpressing Drp1 rescues α-synuclein induced mitochondrial dysfunction and neurodegeneration.
(A – C) Rescue of locomotor deficits (A) and neuronal loss (B and C) by overexpression of Drp1 (UAS-Drp1) in α-synuclein transgenic flies. Scale bar, 20 μm. n=60 (A) and n=6 (C) per genotype. Control (ctrl) is elav-GAL4/+; Syb-QF2/+.
(D and E) Mitochondrial length is normalized by overexpression of Drp1 (UAS-Drp1) in α-synuclein transgenic flies. Scale bar, 10 μm. n=6 per genotype. Control (ctrl) is elav-GAL4/+; UAS-mito-GFP/+; Syb-QF2/+.
(F) Mitochondrial protein oxidation as monitored by the transition from green to red fluorescence in MitoTimer protein is rescued by Drp1 expression (UAS-Drp1) in α-synuclein transgenic flies. n=6 per genotype. Control (ctrl) is elav-GAL4/+; UAS-MitoTimer/Syb-QF2.
(G and H) MitoSOX Red fluorescence is reduced by Drp1 overexpression (UAS-Drp1) in α-synuclein transgenic flies. Scale bar, 50 μm. n=6 per genotype. Control (ctrl) is elav-GAL4/+; Syb-QF2/+.
(I and J) Drp1 localization to the mitochondria, as monitored by HA-tagged Drp1 (HA-Drp1), is restored following Drp1 overexpression (UAS-Drp1) in α-synuclein transgenic flies (arrows). Scale bar, 5 μm. n=6 per genotype. Control is elav-GAL4/+; UAS-Drp1, mito-GFP/+; HA-Drp1/Syb-QF2.
Asterisks indicate *p<0.01, **p<0.001 and ***p<0.002, two-way ANOVA in (A) and one-way ANOVA in (C), (E), (F), (H) and (J) with Student-Newman-Keuls test. Data is represented as mean ± SEM. Flies are 10 days old except for (C) in which flies are 20 days old.
See also Figure S5.

