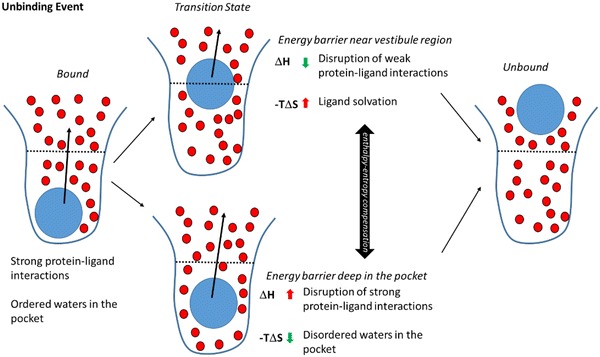
Fig. 4.

Schematic overview of the two alternative transition state locations detected by the suMetaD protocol for the ligand unbinding event. As in Fig. 3, the ligand is represented by a blue circle, waters by smaller red circles, the pocket by a blue line divided by a black dotted line in the orthosteric site (bottom half) and the vestibule region (top half). Starting from the bound state (left) with strong protein–ligand interactions and ordered waters the ligand reaches the unbound state (right). Two alternative ligand locations corresponding to the transition state have been detected: on the top, the energy barrier is near the vestibule region; on the bottom is deep in the orthosteric site. They are characterized by opposite enthalpic and entropic components related to the solvation of the binding site and of the small molecule
