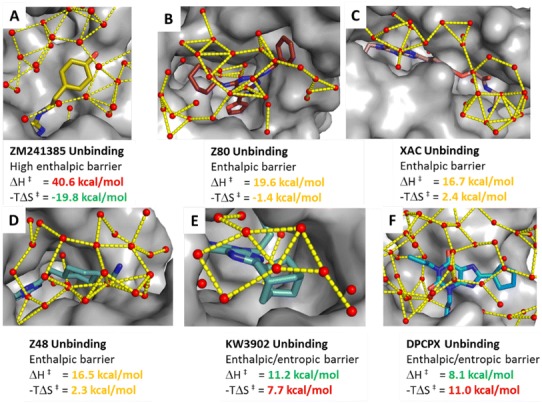
Fig. 6.

Protein–ligand positions/conformations corresponding to the unbinding kinetic bottlenecks detected by the suMetaD protocol for the 6 small molecules considered in this study. The ligand is shown in stick representation, the pocket as solid grey surface and waters as small spheres. Interactions among waters in the vestibule region near the ligand and among the extracellular loops are shown as yellow dotted lines. The experimental energy of the enthalpic (ΔH‡) and entropic (−TΔS‡) components of the TS is reported
