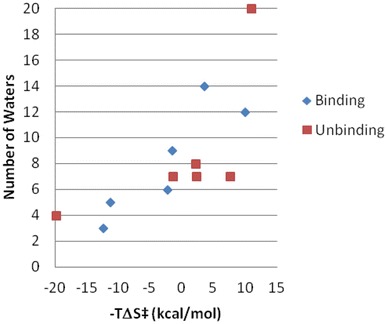
Fig. 7.

Role of the solvent in the transition state entropic energy barrier. The experimental binding (blue) and unbinding (red) TS entropic barrier for the 6 ligands considered in this study is plotted on the X-axis. The Y-axis shows for the binding event (blue) the corresponding number of temporary trapped waters in the orthosteric site in the representative TS conformation. For the unbinding event (red), the Y-axis includes the number of waters in the extracellular side of the receptor at less than 4 Å from the ligand aliphatic carbon atoms in the representative TS conformation
