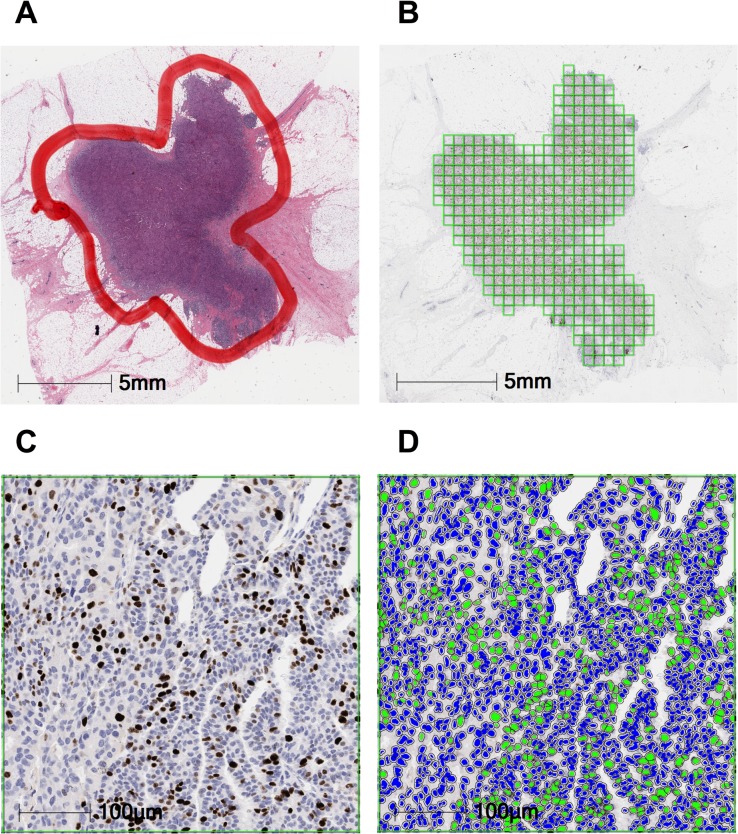
Fig 1. Overview of the automated image analysis workflow.
An H&E of the tumor specimen was manually annotated by a pathologist (A). Annotations were transferred to the matching Ki67-stained slide, and segmented into tiles (B). Ki67-positive and -negative nuclei in each tile (C) were identified and counted by the analysis algorithm, which colored them green and blue, respectively (D).

