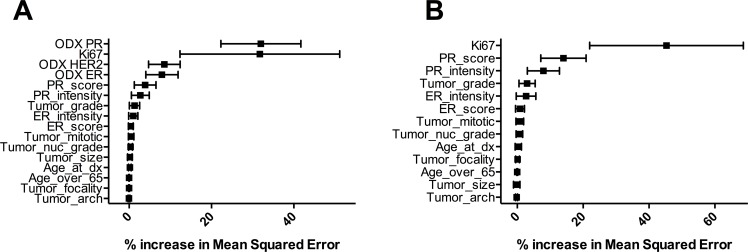
Fig 5. Contribution of individual variables to the accuracy of the respective Random Forest models, as assessed by increases in mean squared error for models created without each variable.
Graphs represent models after 1,000 cycles of validation trained with both clinico-pathological data and Oncotype DX expression data for ER, PgR and HER2 (A) or with clinico-pathological data alone (B). Error bars represent standard deviation from the mean. ER intensity, estrogen receptor staining intensity; ER score, estrogen receptor expression score (immunohistochemistry); PR intensity, progesterone receptor staining intensity; PR score, progesterone receptor expression score (immunohistochemistry); ODX ER, Oncotype DX estrogen receptor gene expression score; ODX HER2, Oncotype DX HER2 expression score; ODX PR, Oncotype DX progesterone receptor gene expression score; Tumor_arch, tumor differentiation score; Tumor_nuc_grade, tumor nuclear grade.

