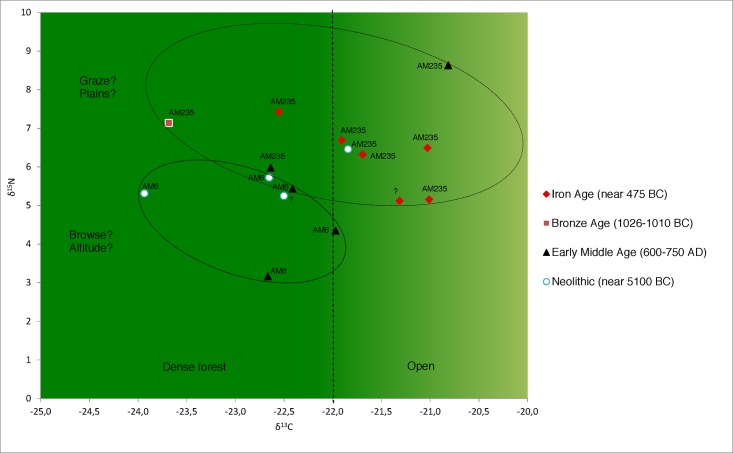
Fig 4. Scatter-plot of δ13C and δ15N values for archaeological red deer collagen according to their age and haplotype.
Ellipses are drawn manually to encompass samples with the same haplotype. One ellipse (below) corresponds to individuals living deep in the forest (mostly browser habits); the other (above) individuals living in open habitats or open (plain) or herb-rich woodlands of the adjacent plains.

