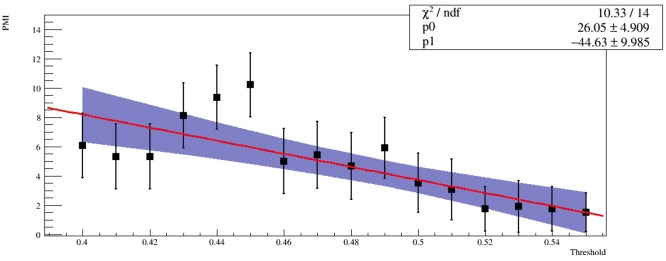
Fig 6. Average PMI distribution.
Average Pivotal Module Index (PMI) distribution for the four community detection methods fitted with a linear model. The blue area represents 95% confidence intervals for the fitted function. Statistical errors were estimated by means of the bootstrap procedure. In the top right corner the reduced χ2 and fit parameters are been shown.

