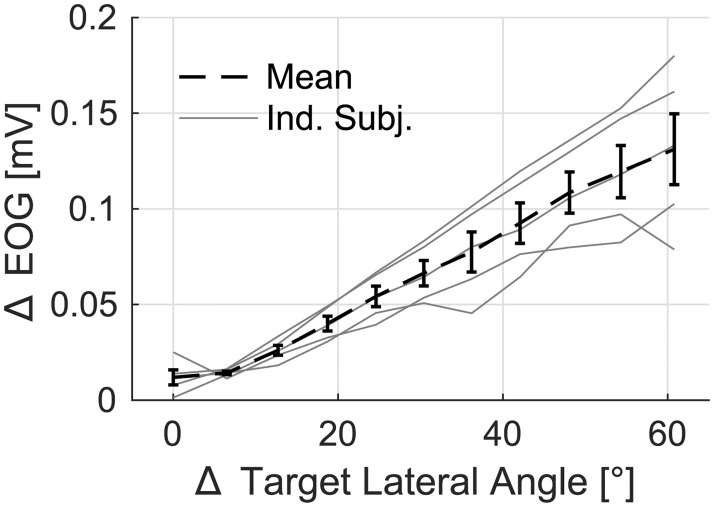
Fig 7. The change in the in-ear EOG as a function of the change of target angle.
The magnitude of the change in the visual target is shown on the x-axis. The change was defined as the difference between the medians of the pre-transition and post-transition periods. This was computed for each trial and each participant. Data of individual participants are shown using thin grey lines, the across-subject mean value and SEM error bars are shown with the dashed line.

