
Fig 5. Analysis of the aortic valve proteome.
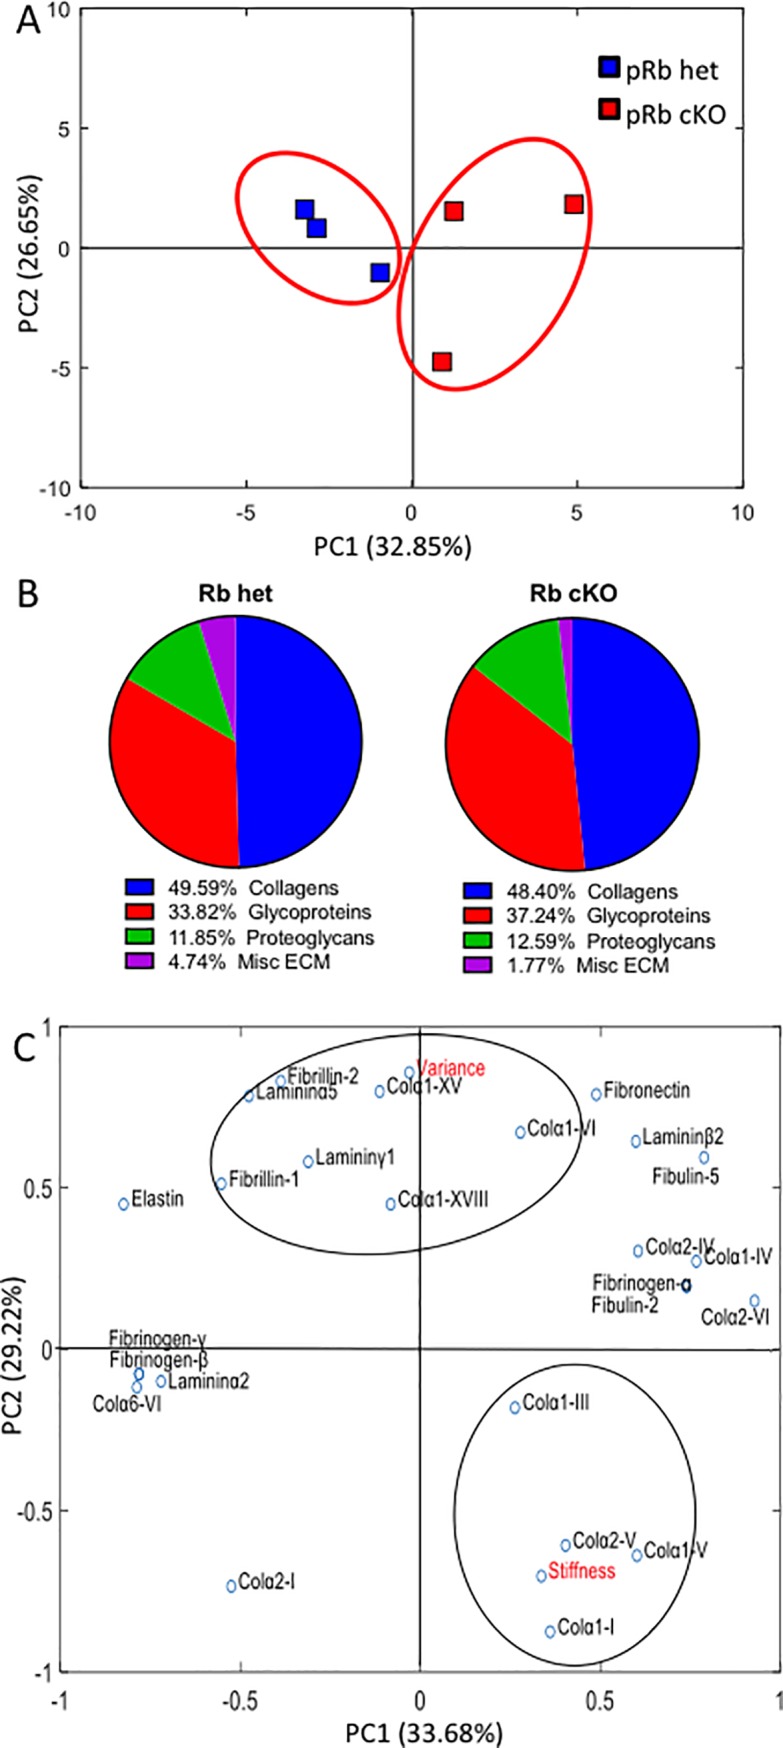
Data represented as protein spectral counts normalized to total ECM and cellular protein spectral counts in samples from LC/MS/MS analysis of trypsin-digested valve leaflet tissue. pRb het were compared to pRb cKO mice with AR and grouped using k-means clustering. A) Principal Component Analysis (PCA) of all ECM and cellular protein counts that show substantial up (greater than 1.5 times) or down (less than 0.6) regulation of pRb cKO leaflets as compared to het controls, demonstrating clustering of both sample types. B) ECM composition breakdown of aortic valve leaflets describes the relative percentages of the matrix proteins in pRb cKO leaflets compared to the pRb het mice. C) Loading scores plotted for a PCA combining measured functional data (in red) with structural ECM proteins. Assuming 4 groups, k-means clustering was use to assess the relationships between the functional data and the proteomics output to look for ECM components that varied with the functional data outcomes. N = 3 per genotype.