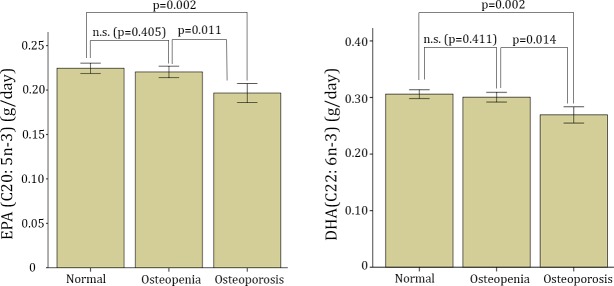
Fig 1. Dietary intake of EPA and DHA according to the WHO diagnosis criteria for osteoporosis.
Bars represents mean±C.I 95%. Significant differences were found for the EPA and DHA intake between normal vs osteoporosis and for osteopenia vs osteoporosis groups; p-values after further adjustment by energy intake (kcal/day) (ANCOVA test).

