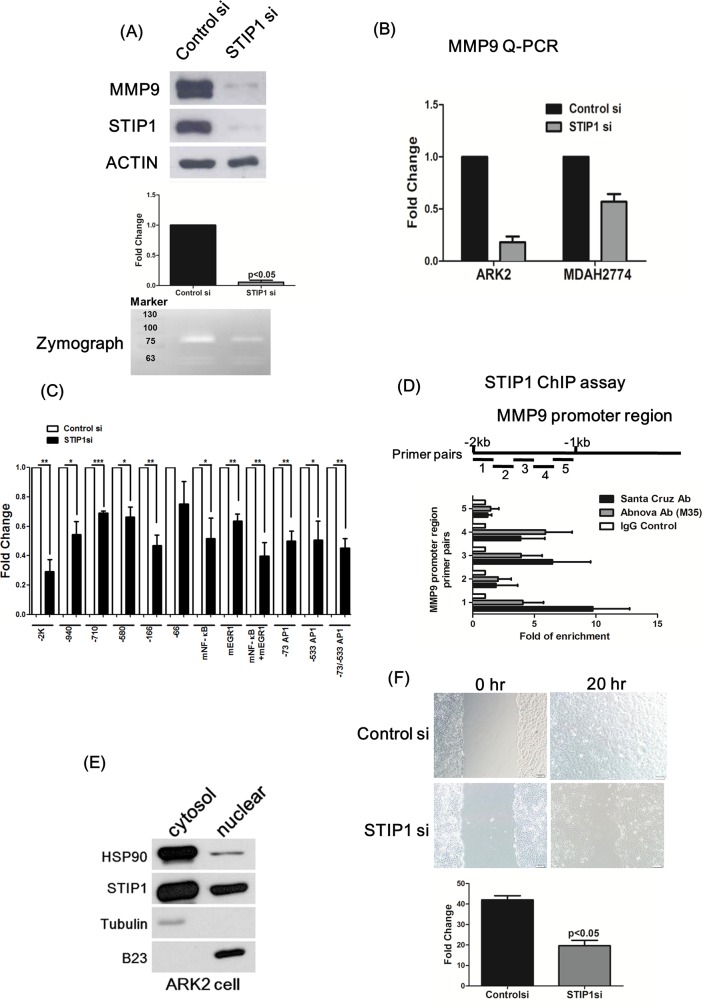
Fig 2. STIP1 binds to the MMP-9 promoter and is required for MMP-9 expression.
(A) ARK2 cells were transfected with the control (scrambled) or STIP1 siRNAs. The protein levels of MMP-9, STIP1, and actin were analyzed using western blot. The bar graph summarizes the decreased protein levels of MMP9 that were caused by STIP1 knockdown in three independent siRNA experiments. A representative zymograph (lower panel) exemplifies the decreased MMP-9 activity that was caused by STIP1 knockdown. (B) At 72 h after transfection of the control or STIP1 siRNA, real-time quantitative polymerase chain reaction (RT-QPCR) was used to quantify MMP-9 RNA levels in the ARK2 and MDAH2774 cells. (C) ARK2 cells were transfected with various MMP-9 reporter constructs (described in the “Methods” section) in the presence of the control or STIP1 siRNA. Reporter activity was measured using the luciferase assay. Individual control (the empty bar for each reporter assay) indicated reporter activity in the cells cotransfected with the designated reporter construct and a control STIP1 siRNA, the activities of which were set as 1. Results are expressed as mean ± standard error from three independent experiments. Statistical differences were calculated with Student’s t-test. *p < 0.05, **p < 0.01, and ***p < 0.001. (D) Identification of STIP1 potential binding sites on the MMP-9 gene promoter (from −1 kb to −2 kb upstream of the transcriptional start site). Two commercially available antibodies (each obtained from Santa Cruz and Abnova) were used to pull-down STIP1. Three independent ChIP experiments were performed. Quantification was performed by RT-QPCR, with the results being expressed as mean ± standard error of the mean. (E) Nuclear/cytosolic fractionation of ARK2 cells was performed. HSP90, STIP1, tubulin, and B23 protein levels were quantified with western blot. Tubulin and B23 were used as cytosolic and nuclear markers, respectively. (F) Cell migration ability was blocked when STIP1 expression was silenced (quantification shown in the lower panel). Results are expressed as mean ± standard error of the mean from three independent experiments. Statistical differences were calculated using Student’s t-test.

