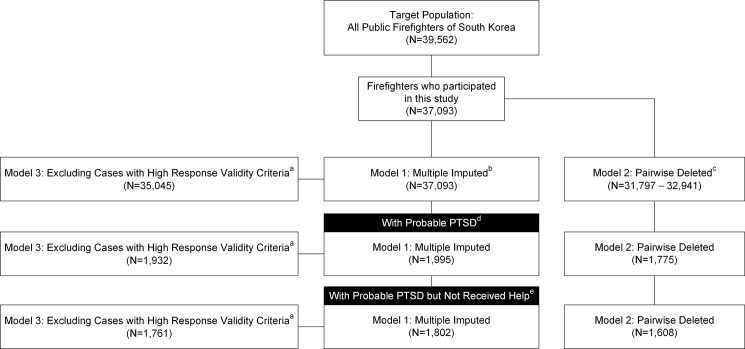
Fig 1. Participant response rate throughout recruitment and data analyses.
a Excluded individuals who could be faking good, answering randomly, or lying. b Imputed datasets were generated using the chained equations approach [37]. c Numbers are expressed in range due to the varying numbers of missing values for each variable. d Current probable posttraumatic stress disorder (PTSD) was defined as ≥ 45 on the PTSD checklist. e Those who had not received treatment from any professional during the past month.

