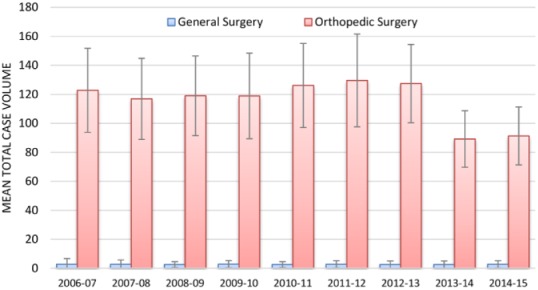
Figure 1.

Total operative hand experience for general surgery and orthopedic surgery residents.
Note. Bars represent mean total case volume. Error bars represent standard deviations. During each year, orthopedic surgery residents performed more hand surgery cases (P < .001). There was a decrease in case volume from 2013 to 2014 onward for orthopedic surgery (P < .001), whereas case volume for general surgery remained stable (P > .05).
