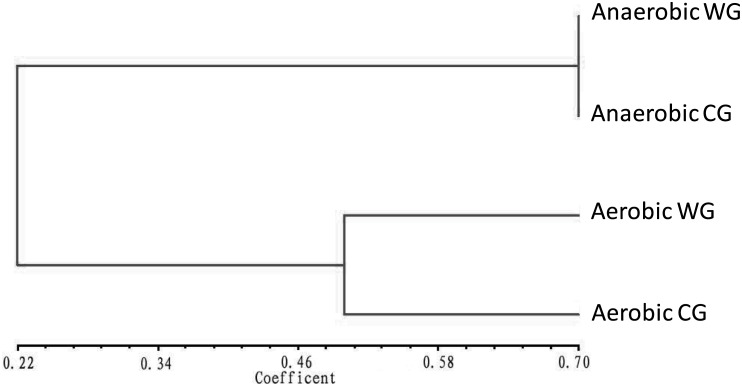
Fig 2. Dendrogram of DGGE profiles of PCR-amplified partial 16S rRNA gene fragments from different bacterial communities in the fermentation chamber of H. parallela larvae.
The clustering dendrogram was constructed based on the Euclidean squared distance coefficient, which was followed by an unweighted pair-group method analysis (UPGAMA) method. The value of similarity level was indicated on the bottom line. WG: group of fermentation chamber wall. CG: group of fermentation chamber content.

