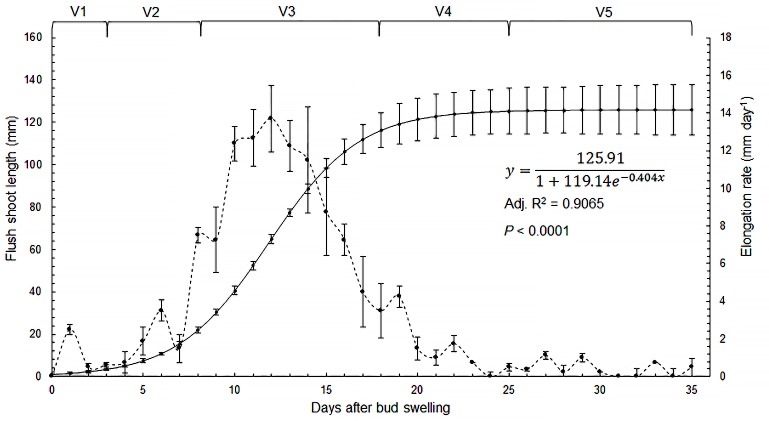
Fig 2. Flush shoot growth.
Adjusted curve describing flush shoot length (continuous line; sigmoidal logistic curve selected based on the AIC [59]), elongation rate per day (dashed line) and approximate duration and length of each stage during ontogeny (vertical lines are standard error of the mean of the original data, n = 4 plants) (See S1 Apendix).

