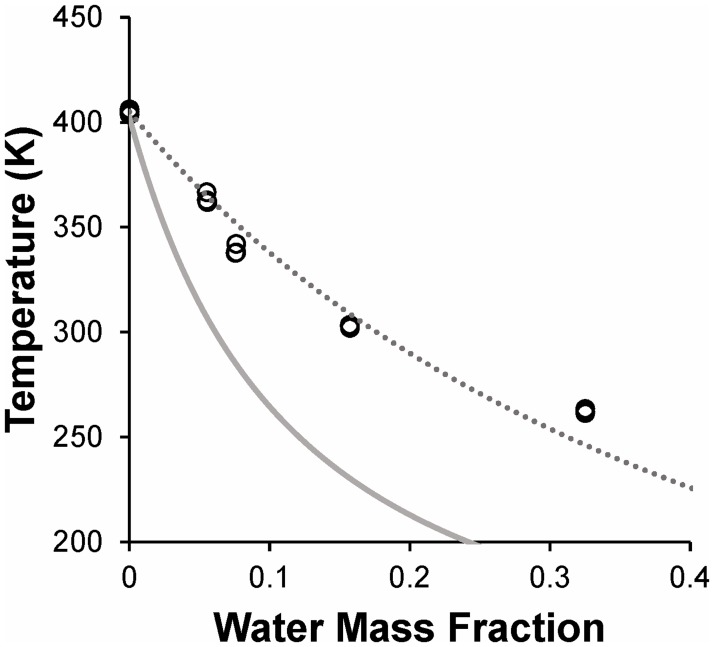
Fig 4. Glass transition temperature of trehalose-PVP-water mixtures.
Samples were prepared by equilibrating freeze-dried matrix in various relative humidity environments. The dotted line shows the best fit of the GT model (Eq 1) to the data. The solid line shows predictions of the CK model (Eq 2) using the parameters shown in Table 3.

