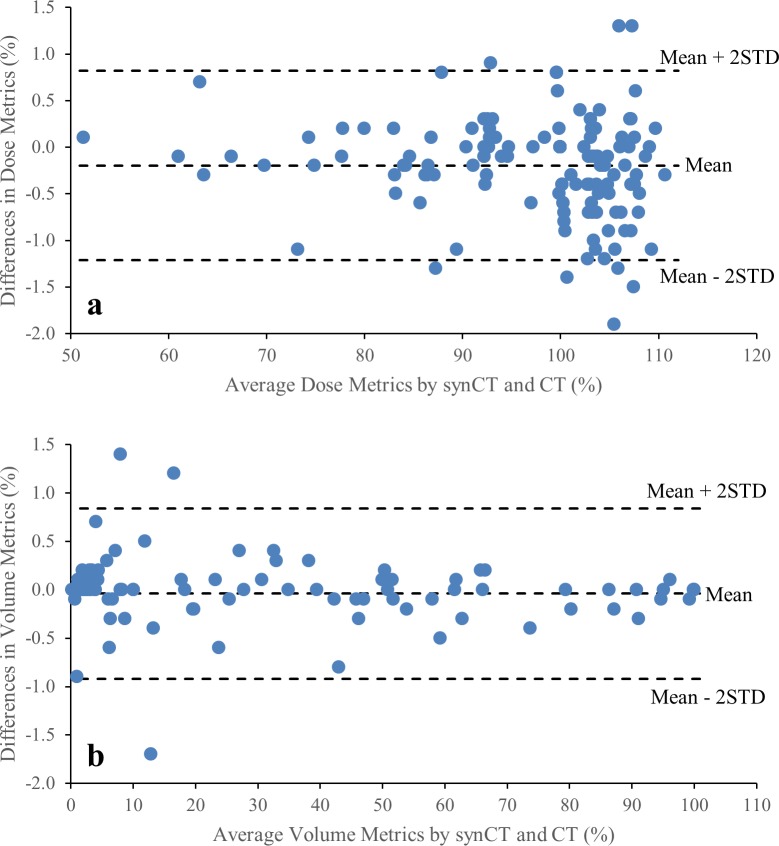
Fig 3. synCT-to-CT differences against metric average from synCT and CT.
(a) was for dose metrics of PTV D100%, D95%, D2%, Dmean and Bladder Dmean, (b) was for volume metrics of Bladder V40Gy, Bowel V45Gy and Femoral Head V30Gy. The limit of agreement was calculated as (Mean-2STD, Mean+2STD) of the metric differences.

