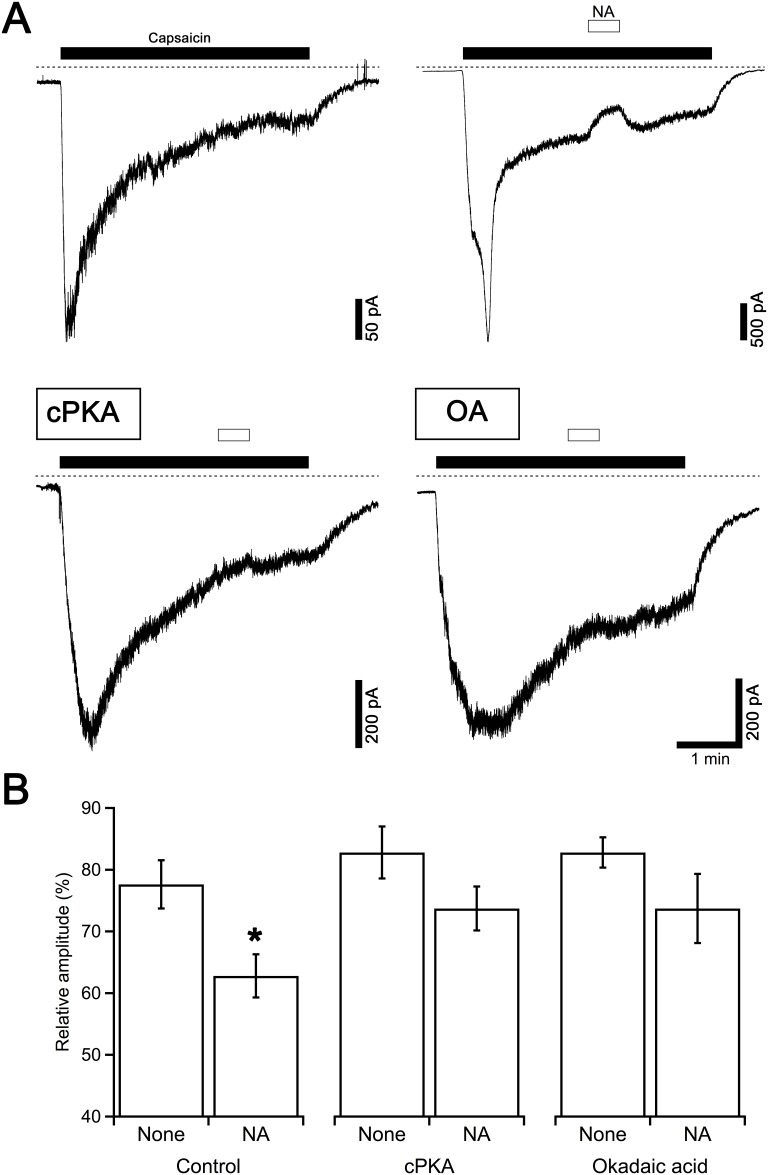
Fig 4. Effects of cPKA and OA on the NA-induced suppression of capsaicin currents.
(A) Typical control current responses to capsaicin (1 μM) applied for 4 min are shown in the upper left panel. NA (1 nM) was applied 2 min after the beginning of the capsaicin application for 30 s. Current traces in the lower panels were recorded from the neurons dialyzed with the pipette solution containing cPKA (250 U/ml, left) and OA (1 μM, right) in the same protocol. Dashed lines indicate zero current level. (B) The relative amplitudes of the capsaicin currents at the end of the NA application compared to those just before the application of NA are shown. The columns and vertical bars indicate the mean ± SEM (n = 12, 33, 5, 11, 8 and 10 from the left). * P < 0.05 against the control data in the absence of NA (none).

