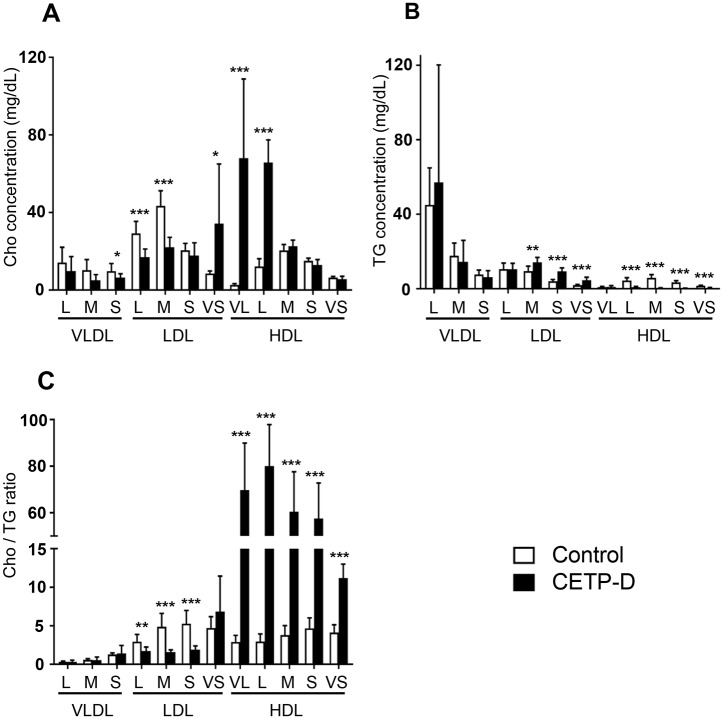
Fig 2. Concentrations of A: Cho (mg/dL), B: TG (mg/dL), C: Cho/TG ratio in lipoprotein subclasses between normolipidemic subjects (n = 9, open column) and CETP-D patients (n = 9, closed column).
VL = very large; L = large; M = medium; S = small; VS = very small. All graphs show the mean ± SD. *P<0.05, **P<0.01, ***P<0.001 vs normolipidemic subjects.

