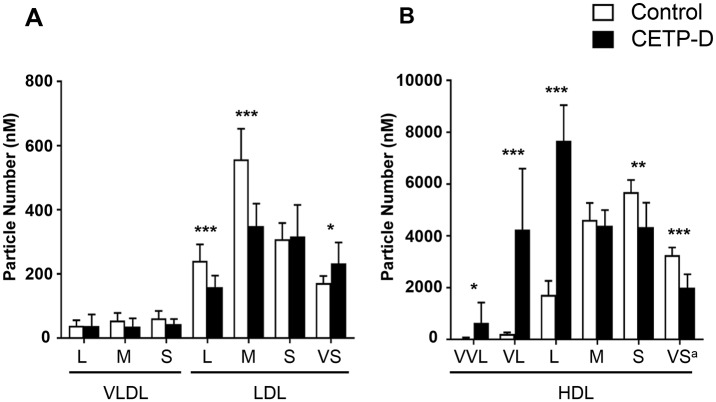
Fig 4. Comparison of particle number of each lipoprotein subclass between normolipidemic subjects (n = 9, open column) and CETP-D patients (n = 9, closed column).
(A) VLDL to LDL fraction, (B) HDL fraction. VVL = very very large; VL = very large; L = large; M = medium; S = small; VS = very small. a PN of very small HDL is assessed only by the PN of HDL6, because HDL7 contains pre-beta-1. HDL for which spherical particle model cannot be applied. All graphs show the mean ± SD. *P<0.05, **P<0.01, *** P<0.001 vs normolipidemic subjects.

