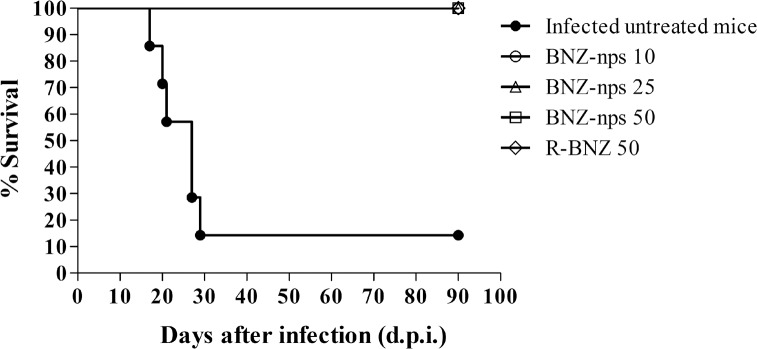
Fig 3. Survival curve in C3H/HeN mice infected with 1000 trypomastigotes of TcN and treated with 30 oral doses of R-BNZ 50, BNZ-nps 50, 25 and 10 mg/kg/day, respectively.
To assess differences among survival curves, a log-rank test of Kaplan–Meier was performed, which showed significant differences between both infected treated and untreated mice (p < 0.0001).

