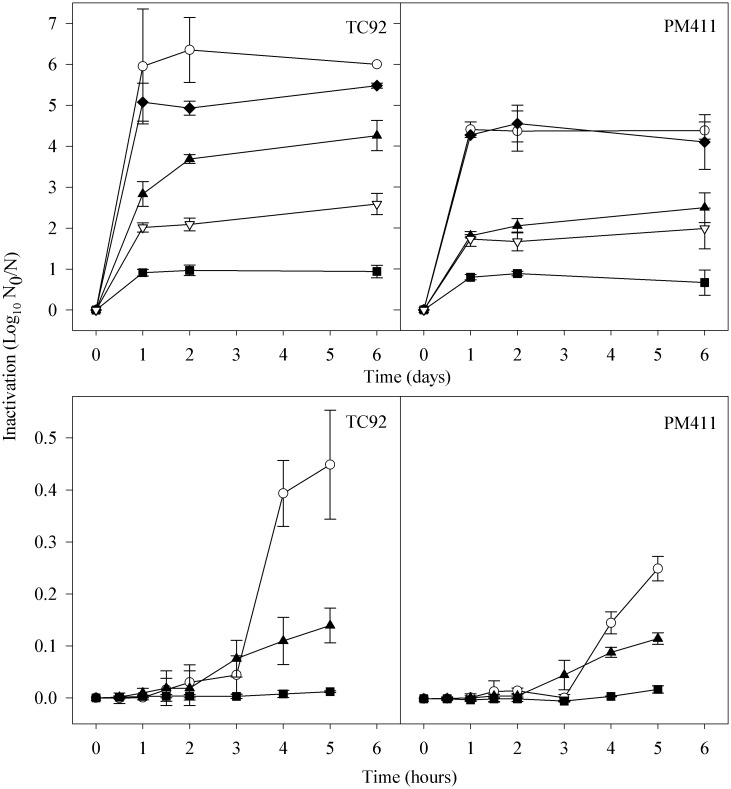
Fig 2. Effect of adaptation treatments on cell inactivation in L. plantarum TC92 and PM411 during desiccation.
Long-term (top panels) and short-term (bottom panels) periods. Non-adapted, N (○), acid adapted, A (▲), hyperosmotic adapted, O (♦), stationary phase adapted, S (▽), and combined-stress adapted, C (■) cells. Inactivation is shown as log N0/N, where N0 is the initial number of cells and N is the number of survivors. Values are the mean of three independent biological replicates and error bars represent the standard deviation of the mean.

