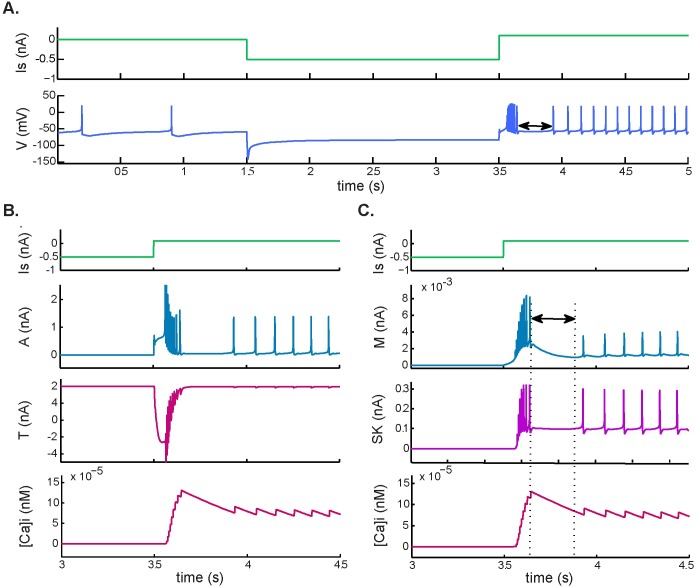
Fig 4. Postinhibitory rebound and post-stimulation recovery.
Response to a hyperpolarizing pulse of −0.5 nA followed by a depolarizing pulse of 0.6 nA. A. Simulated membrane potential during current application. B. Postinhibitory rebound, involving an increase in A-type potassium and T-type calcium currents and an increase in intracellular calcium ([Ca2+]i). C. Post-stimulation recovery after postinhibitory rebound. This behavior was associated with accumulation of [Ca2+]i and increased M-type and SK potassium currents.

