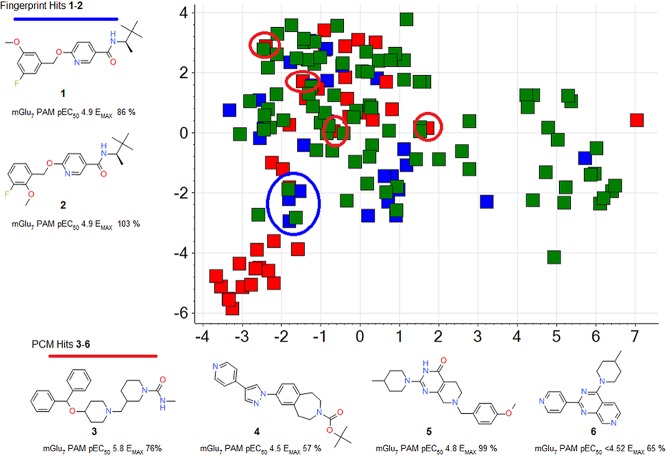
Figure 5.
Stochastic proximity embedding (SPE) diversity map capturing the substructural diversity of the primary screening hits. Primary screen hits from PCM are shown in red, and hits from only fingerprint analogues of mGlu7 actives are shown in blue. The plot highlights the diversity of the PCM hits (red) compared to the initial fingerprint queries (green) and the resulting fingerprint hits (blue). ECFP4 fingerprints were used as descriptors. SPE generates low-dimensional Euclidean embeddings that preserve the similarities between the chemical structures.46 Confirmed hits from fingerprints are molecules numbered 1 and 2 whose structures are shown in the top left, and their location in the diversity map is within the blue circle. Meanwhile, hits from PCM are numbered 3 to 6, their structures are shown in the bottom of the figure, and their locations in the diversity map are circled in red. The hits from PCM extend into a diversity space beyond those of the fingerprint queries and hits.

